FRY METHOD
Ramsay (1967) developed a method of determining two-dimensional geological strain by measuring center-to-center separation of objects. The aim was to measure bulk strain in rocks with rigid objects in a deformable matrix, or with objects that had undergone pressure solution, for example. The underlying assumption is that, in the undeformed rock, object centers are roughly the same distance apart in all directions. After deformation, distances are relatively extended in the direction of the strain ellipse long axis and shortened in the direction of the short axis. Ramsay suggested measuring the distances from each particle center to the centers of its nearest neighbors and plotting these data on a length versus direction graph. This method may, however, underestimate the total strain. Nearest neighbors in the undeformed rock do not always remain so after significant deformation. Some center-to-center distances become so elongated that the particles are no longer neighbors and centers that were quite far apart come close together and become new nearest neighbors. Omission of the most stretched center-to-center joins and inclusion of shortened ones makes the plot of final nearest neighbor separation versus direction look more or less the same regardless of strain intensity. Ramsay's method works well for distributions of mud crack centers and colonial corals, where the identities of nearest neighbors are easy to determine from shared boundaries, but spurious results may be obtained for other particle distributions such as conglomerate pebbles that can shuffle past one another. Measurement of center-to-center joins that do not pass through other objects (instead of nearest neighbor joins) works in limited circumstances where particle outlines are clearly visible and particles deform homogeneously with their matrix. However, these conditions are restrictive; a better solution was discovered by Fry (1979).
For successful Fry analysis, particle distributions must be anticlustered - i.e. centers must, on the whole, maintain a uniform minimum distance from one another. The center-to-center distances between every pair of particles are measured and plotted on a polar diagram. Because all center-to-center distances are plotted, there is no over-sampling of short joins or under sampling of long ones. The manual plotting technique involves placing a tracing overlay with a coordinate origin and pair of reference axes on top of a photograph or sketch of the specimen that also has a reference grid marked on it (see, for example, Simpson 1988). The origin is aligned with a particle center and the centers of all other particles are marked on the tracing paper. Then the origin is moved onto a second particle center and the procedure is repeated. Care must be taken to translate the tracing overlay without rotating the reference axes.
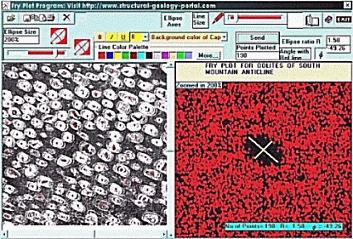
The application called "Fry Analysis" solves the problems of speed and accuracy associated with the manual plotting of Fry diagrams. Data is entered by opening a preexisting data file or by digitizing points with a mouse-click using a template - a scanned image of the rock specimen or outcrop surface. The program constructs the plot of all center-to-center distances in a matter of seconds. For tutorial purposes, the computer may be instructed to plot points more slowly, following the same procedure that humans would use with pencil and paper. Here, the gray shaded area represents the sheet of paper containing the raw data on the left, the point enclosed in a box is currently at the center of the Fry plot and the pencil is marking each point onto the Fry diagram.
A Fry plot for an undeformed, anticlustered distribution of particles gives a mass of points with a circular area in the center of the plot in which there are no points. The radius of the central hole is controlled by the minimum distance between centers. There may also be a dense ring of points concentric with and just outside the central hole, reflecting the modal center-to-center separation. For a deformed anticlustered distribution, the Fry plot gives a similar mass of points, but the hole in the center of the plot and the band of high density surrounding it are elliptical.