| beta
AND pi DIAGRAMS
The two diagrams are used to
represent the structural pattern or to support the observed pattern. A b
diagram is the one on which measured planes are plotted as cyclographic
traces, a p
diagram is the one on which normals or poles to planes are plotted.
Usually for small number of data and involving simple or statistically
cylindrical structures or for simple exercises or computations, b
diagram is preferred.
For large data and complex deformation patterns the p
diagram is preferred. If in the latter case, a b
diagram is drawn, it gives rise to non-significant
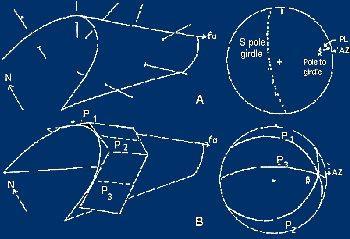
Diagrams given to author by M J Fleuty
|