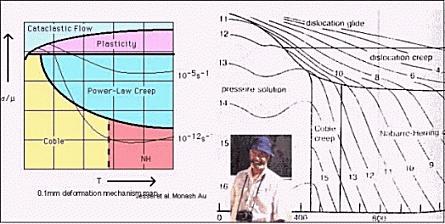
DEFORMATION MECHANISM MAPS
These are graphs in typically stress-temperature space (but also grain size-temperature and others) which show which deformation mechanisms dominate under which conditions FOR A PARTICULAR MINERAL. They are contoured in strain rates, showing the strain rate that would be achieved by that process alone under the appropriate conditions. They only show dominance in terms of which mechanism is likely to account for the most strain, the label in any particular field does NOT mean that no other mechanism or process is active, and it does NOT mean that the microstructural development will be controlled by that labeled mechanism, in fact it does not even mean that the deformation mechanism is the dominant process in terms of microstructural evolution. It would be nice if we had general Microstructral process mechanism maps. Inset is a photo of Prof E H Rutter.