| FOURIER OR HARMONIC
ANALYSIS OF FOLDS
Stabler (1968) first devised the method of analysing fold shapes in
terms of the harmonic coefficients of a Fourier series. Hudleston (1973)
considerably developed this method. The standard equations related to a
Fourier series can be found in any text book of statistics. The geometry
of a folded surface or a part of it could be considered in terms of its
harmonics if the fold surface or a part of it could be considered to be
regularly periodic. A quarter wavelength unit (W/4) is divided into equal
sectors on a line which is a perpendicular from the inflexion point onto
the axial surface trace and f(x) is measured at each of these points and
from
2N
a m=2/2N+1 S
f(xp) cos 2ppm/2N+1
p=0
2N
bm=2/2N+1
Sf(xp)sin
2ppm/2N+1
p=1
a m and
bm
could be calculated by an
electronic calculator or by using a digital computer. As many as N number
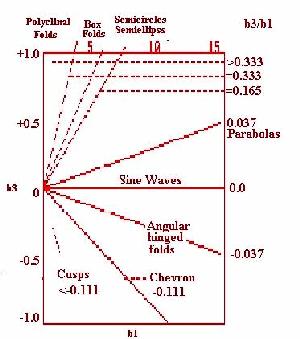
of harmonic coefficients could be computed. The first two odd harmonics
(Coefficients b1 and b3 ) are sufficient to describe the fold profile
shape most satisfactorily. A plot of b3/b1 is shown in the Fig. Different
fold shapes fall in different fields as shown in the figure. While b1 is a
measure of the amplitude, b3 is a measure of the angularity or sharpness
of the hinge area. In original Fig.of Hudleston (1973) are shown radiating
lines beginning from origin designated alphabetically from A to F. Also
shown are five slightly curved lines numbered 1 to 5. These two sets of
lines intersect in 30 points which Hudleston considers as 30
"ideal" shapes each of Which has a particular b3 /b1 ratio.
These ideal shapes have been reproduced in another fig. These ideal shapes
can be reproduced on a Perspex sheet and any fold shape in profile
irrespective of its size can be viewed through it and matched with one or
a combination of two shapes and noted in the field diary or notebook as 3C
or E4. This is the visual method of harmonic analysis, in which case the
first two coefficients of a fold shape can be simply calculated in terms
of one or two of the standard 30 shapes. The program listing of FOURBIN
prepared by Hudleston is in a table which you can copy to the clipboard at
the end of this description.
C PROGRAM FOURBIN
C FOURIER ANALYSIS OF FOLD PROFILES
C WRITTEN BY P J HUDLESTON, DEPARTMENT OF GEOLOGY, IMPERIAL
C COLLEGE OF SCIENCE AND TECHNOLOGY, PRINCE CONSORT ROAD LONDON SW7
C APPENDIX IN PH.D. THESIS OF THE UNIVERSITY OF LONDON 1969
C TITLED "MORPHOLOGY AND DEVELOPMENT OF FOLDS IN ROCKS" PP.365-367
C SCALE = THE VALUE OF W/4
C M= NUMBER OF COEFFICIENTS TO BE COMPUTED
C FNT= THE VALUES OF F(X)
C FIRST DATA CARD GIVES THE NUMBER OF DATA SETS THAT FOLLOW
C EACH DATA SET CONSISTS OF TWO CARDS, THE FIRST CONTAINS THE VALUES
C OF N, M AND SCALE AND THE SECOND N VALUES OF FNT
C
C PROGRAM LISTING
DIMENSION A(40), B(40), FNT(100), AFNT(100), COEF(100)
READ (0,99) NUMBER
KOUNT=0
11 KOUNT=KOUNT+1
WRITE(0,202) KOUNT
READ (0,101) N, M, SCALE
WRITE(0,204) N, M, SCALE
SCALE=3.141593/(SCALE*2.0)
NMID=N+1
FNT(1)=0.0
READ (0,102) (FNT(I), I=2,NMID )
DO 15 I=1,NMID
15 FNT(I)=SCALE*FNT(I)
I=1
41 I=I+1
J=I-1
K=I+J
AFNT(I)=FNT(K)
IF (NMID-(I+J+1)) 42,43,41
43 J=-2
443 J=J+2
I=I+1
K=NMID-J
AFNT(I)=FNT(K)
C FNT VALUES ARE CONVERTED BY SCALE FACTOR THAT MAKES THE PERIOD
C EQUAL TO 2 PI.
C THE N+1 VALUES OF FNT IN THE RANGE 0-PI/2 ARE ARRANGED IN CORRECT
C ORDER IN THE RANGE 0-2 PI
IF (I.EQ.NMID) GO TO 65
GO TO 443
42 J=-1
442 I=I+1
J=J+2
K=NMID-J
AFNT(I)=FNT(K)
IF (I-NMID)442,65,65
65 DO 62 I=2,NMID
62 FNT(I)=AFNT(I)
C 2N+1 VALUES OF FNT IN THE RANGE 0-2PI ARE GENERATEDi
C FROM THE N+1 VALUES IN THE RANGE 0 - PI
DO 25 I=1, N
J=(2*N+1)-(I-1)
25 FNT(J)= - FNT(I+1)
CALL FORIT (FNT ,N ,M , A , B , IER)
IF (IER.GT.0) GO TO 12
MAX= M+1
WRITE (0,201) (B(K), K=1,MAX )
13 IF (KOUNT.EQ.NUMBER) STOP
GO TO 11
12 WRITE (0,203) IER, KOUNT
GO TO 13
99 FORMAT(I6)
101 FORMAT(I6,I6,F8.0)
102 FORMAT(12F6.3,8X)
201 FORMAT (1H ,1HB,3X,7F10.4)
202 FORMAT (///29H RESULTS FOR DATA SET NUMBER , I4 //)
203 FORMAT (1H ,13HERROR NUMBER ,I4,31HON RETURN FROM FORIT
121HWITH DATA SET NUMBER , I4)
204 FORMAT (1H ,2HN=,I6,6X,2HM=,I6,6X,7HSCALE =,F8.5 //)
END
C SUBROUTINE FORIT
C IER=RESULTANT ERROR CODE WHERE IER=0- NO ERROR
C IER=1 - N NOT GREATER OR EQUAL TO M
C IER=2 - M LESS THAN ZERO
C REMARKS
C M MUST BE GREATER THAN OR EQUAL TO ZERO
C N MUST BE GREATER THAN OR EQUAL TO M
C THE FIRST ELEMENT OF VECTORS IS ZERO IN ALL CASES
C METHOD:
C USES RECURSIVE TECHNIQUE DESCRIBED IN RALSTON A AND WILF H
C MATHEMATICAL METHODS FOR DIGITAL COMPUTERS JOHN WILEY AND SONS
C NEW YORK 1960 CHAPTER 24 THE METHOD OF INDEXING THROUGH THE PROCEDURE
C HAS BEEN MODIFIED TO SIMPLIFY THE CALCULATIONS
SUBROUTINE FORIT (FNT,N,M,A,B,IER)
DIMENSION A(100), B(100), FNT(100)
C CHECK FOR PARAMETRIC ERRORS
IER=0
20 IF (M) 30,40,40
30 IER=2
RETURN
40 IF (M-N) 60,60,50
50 IER=1
RETURN
C COMPUTE AND PRESET CONSTSNTS
60 AN=N
COEF=2.0/(2.0*AN+1.0)
CONST=3.14159*COEF
S1=SIN(CONST)
C1=COS(CONST)
C=1.0
S=0.0
J=1
FNTZ=FNT(1)
70 U2=0.0
U1=0.0
I=2*N+1
C FORM FOURIER COEFFICIENTS RECURSIVELY
75 U0=FNT(I)+2.0*C*U1-U2
U2=U1
U1=U0
I=I-1
IF (I-1) 80,80,75
80 A(J) = COEF*(FNTZ+U1-U2)
B(J)=COEF*S*U1
IF (J-(M+1)) 90,100,100
90 Q=C1*C-S1*S
S=C1*S+S1*C
C=Q
J=J+1
GO TO 70
100 A(1)=A(1)*0.5
RETURN
END
C *******END OF LISTING WITH SUBROUTINE FORIT*************
NOTE BY AUTHOR: On the PC, you must have any version of FORTRAN higher than FORTRAN IV, such as EXTENDED FORTRAN, or WATFOR 77 and the relatd library files and compilers. Use the same READ formats as given in the above listing for data input and the program will work.
|